

The Live Quote Walkthrough.
The challenge
The quote looked like a liability waiver.
Panel counts, degradation curves, financing APRs, and a payback chart were all crammed onto one grayscale page in an 11-point table font. Homeowners didn’t distrust the math — they distrusted a document that looked like nobody had thought about them while making it. So they asked reps to come back with “something to show my spouse,” and a decision that could have happened in one visit stretched into a month of hesitation.
“I believed the numbers. I just didn’t want to sign something that looked like a phone bill.”
— Homeowner, post-close interview

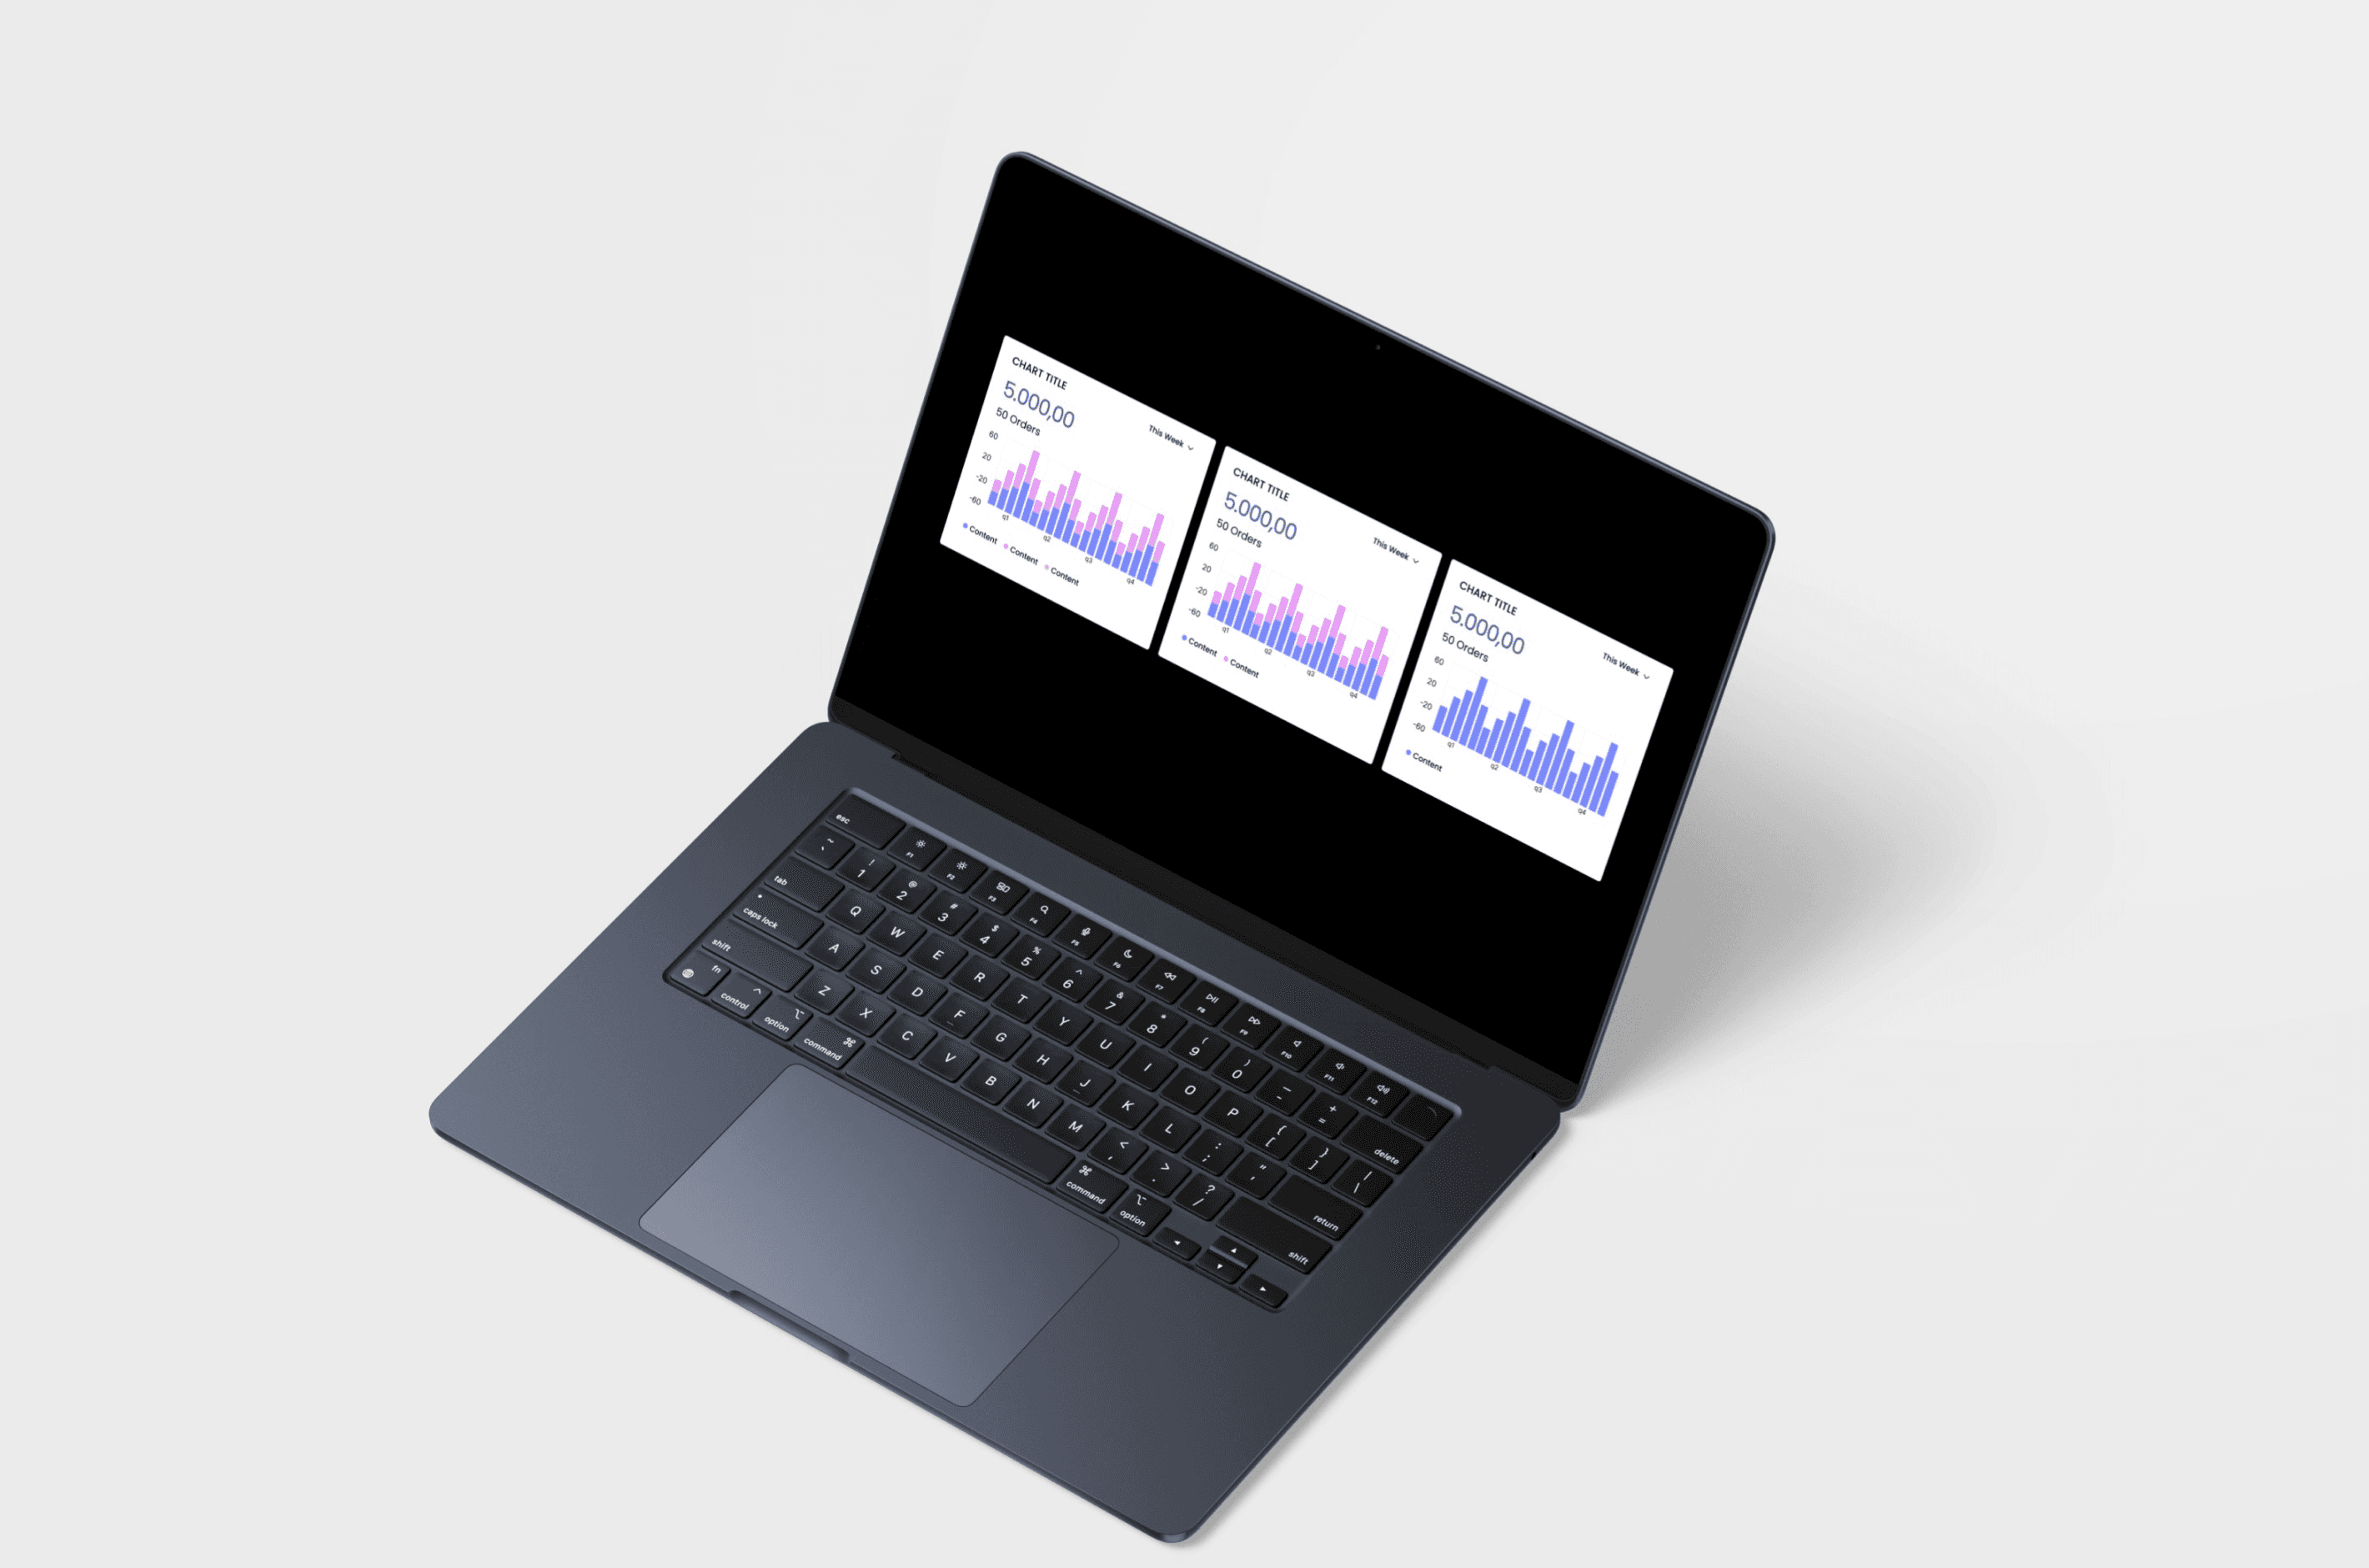
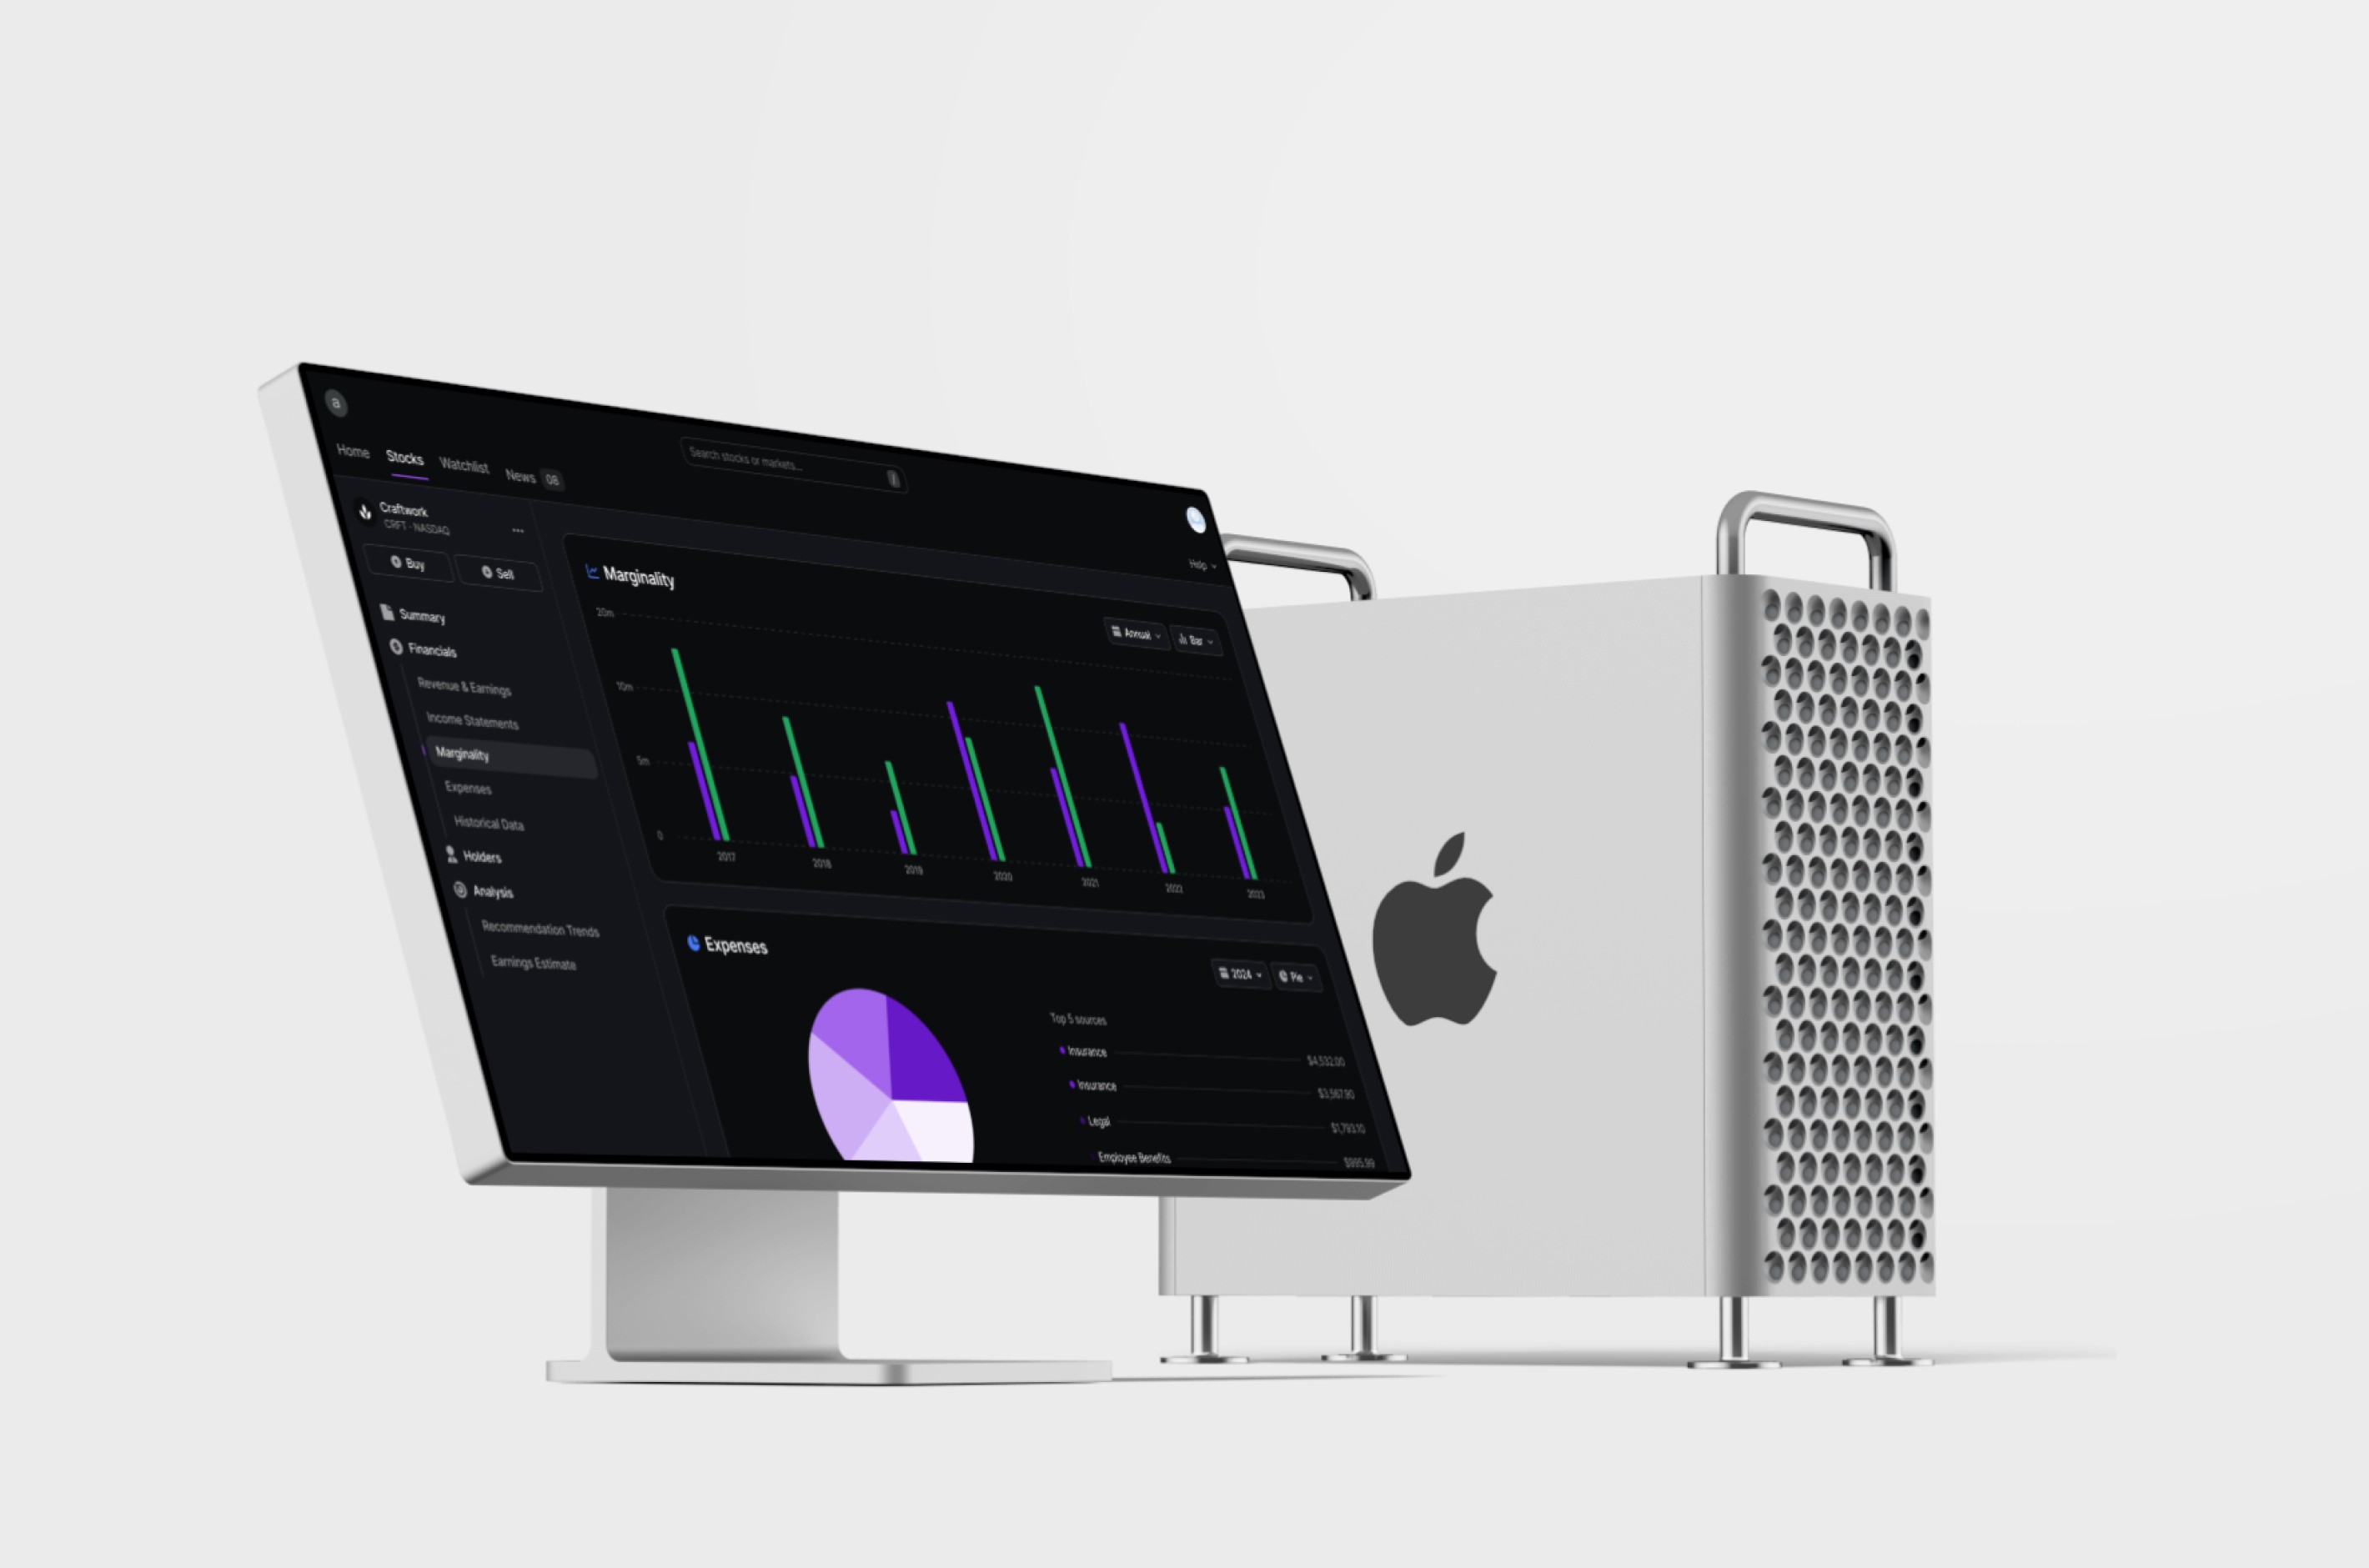
The Live Quote Walkthrough.
The Process
Sat in on eleven kitchen-table pitches. We watched where reps improvised — circling numbers by hand, sketching the roof layout on a napkin — and treated those improvisations as the real interface brief.
One number per screen. Payback period, monthly savings, and system size each got their own moment instead of competing for attention on a single dense page.
Designed for a tablet, not a printer. The quote had been built to be printed and left behind. We rebuilt it to be walked through live, with the rep narrating each screen.
Priced the identity, not just the product. A confident, specific brand mark on every panel diagram and invoice mattered as much as the layout — it’s what a homeowner sees on their roof for twenty years.


Solution
A five-screen live quote. System size, savings, payback, financing, and next steps, each with its own clear number and a simple diagram of their actual roof.
An identity built around the sun path. A mark and palette drawn from the arc of sunlight across a roof, applied consistently from the sales tablet to the install crew’s van wrap.
Editable in front of the customer. Reps could adjust panel count or financing term live and watch the numbers update, instead of promising to “send over a revised quote.”
A one-page leave-behind. For the homeowner who does want something physical, one page, one number per section, printable straight from the tablet.
Outcome
Average visits-to-signature dropped from four to just under two over the following quarter. The clearer signal: 61% of deals now closed on the first visit, up from 22% — the actual goal, since every extra visit was a chance for a homeowner to talk themselves out of it.
What I’d do differently. The five-screen flow assumed a rep controlling the pace. A self-serve version for homeowners browsing the website alone needed a different, more guided sequence, and we treated it as a phase two instead of designing both from the same system up front.
Deals closed on the first visit
+39pts
Average visits to signature
-52%
Homeowners stopped asking us to come back. We just finished the conversation the first time.

Marcus Ibe
Chief Innovation Officer